In-depth analysis of Steam data
Vasantha Chandrasekaran and Saahil Hiranandani

Background
Steam is a video game distribution platform that has gained immense popularity among the gamers across the world. The platform has about 50,000 games and about 120 million monthly active users. By analyzing the Steam Game Platform statistics and session metrics, interesting insights could be obtained. The insights would benefit game publishers in finding the factors that keeps players engaged, gamers in knowing player shares, new genres, and other gaming platform competitors.
In this article, we aim to visualize aspects of the Steam Game Platform such as the recommendation count, the number of free and paid games and their trends with respect to the release month of the games. An interactive dashboard is generated using the source data to observe the correlation in the number of games played and the recommendation count with the release month of the games.
Data
Data for this project comes from Steam Game Data which is a combination of data from publicly available Steam API’s and steamspy.com, inspired by steamdb.info. We have also referred Professor Jill’s In class notebooks for reference.
Interactive visualization
The interactive dashboard shown in Figure 1 shows the number of free and paid games in the Steam Game Platform and the recommendation count in games with respect to the month of release of games. If an interval of months on the left plot is selected using the mouse pointer, the line chart in the right changes according to the interval selected
The left chart is the driver plot that shows the number of free and paid games in the Steam Game platform. The number of free and paid games in each month of release of game can also be observed. The driver plot is linked to the driven plot shown on the right that displays the recommendation count of games in the Steam Game platform as a line chart. The peaks represent the recommendation count in each release month of the games.
The dashboard shows the distribution of free and paid games across the release months of games, the months during which there was an increase or decrease in the number of games played in the platform and how the count of recommendations in the platform impacts the number of games and gaming subscription. It can be seen that more number of games are played and purchased if a game is released in the month of August, and the increase in recommendation count during the same is a correlation that gives insight about the user activity and the platform recommendation activity.
Figure 1 Dashboard showing the free and paid games and recommendation count with their release months
Contextual visualization
For the contextual visualization of the Steam Game dataset, we used the Steam Video Game Hours Played dataset which includes user ID, game title, the behavior including ‘purchase’ and ‘play’ in the Steam Game platform.
The Steam Game dataset includes details about the games with hardware requirements, their genres, recommendation count, release date, response count, achievement count and others but there is no information about the behavior of users in the platform with respect to the number of hours played by users. The contextual dataset- ‘Steam Video Game Hours Played’ includes information about the number of hours played by gamers in the Steam Game platform that helps visualize the overall user activity. This would benefit the developers of the Steam Game platform to improve their overall interface and gamers would be able to see game statistics and individual statistics.
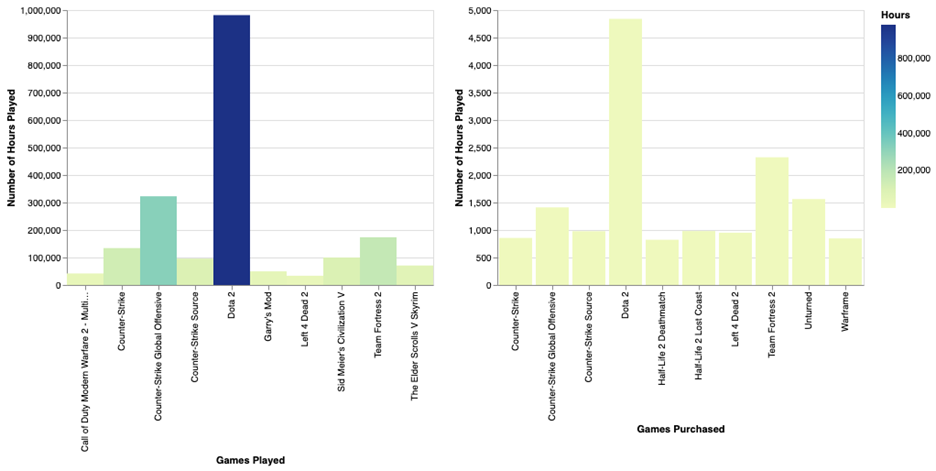
Figure 2 Top 10 free and paid games in Steam Game platform
We created Figure 2 as two non-interactive bar charts. The link to the code is included in the Analysis notebook below. The left chart shows the top 10 games that were played by users in the Steam Game platform with respect to the number of hours played. The right chart shows the top 10 games that were purchased by users in the Steam Game platform. The color map represents the number of hours played by users playing free games and paid games. The charts show that ‘Dota-2’ is the highest played and purchased game as users spend more hours playing the game but the number of hours spent on free games are way more than those of purchased games. This contextual visualization showing the game titles of top 10 free and paid games adds more information to the interactive dashboard shown in Figure 1.
Apart from this visualization, we found a chart from newszoo.com that shows the impact of new content on gaming consoles and daily playtime of users. The chart shown in Figure 3 is an interesting insight about how the playtime spikes during the release month of games on a console. The graph shows the increase in average daily playtime across months when a new season of the game, Apex is launched. This supports the insights obtained from the dashboard shown in Figure 1 that there is a correlation between the playtime of users and the release month of the games.
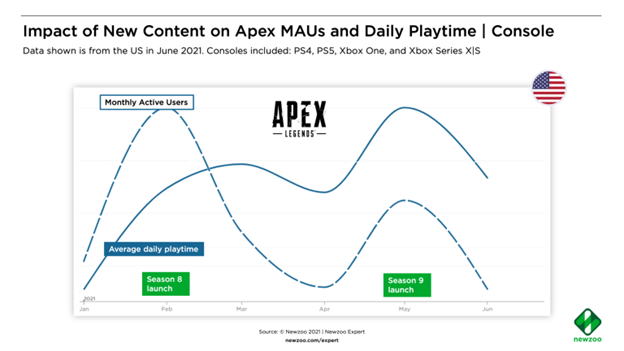
Fig 3. Impact of new gaming content on playtime
Conclusion
By visualizing a dashboard and two charts, we discovered insights about the number of free and paid games on the Steam Game platform and how the count of recommendations on the platform impacts the number of games played with respect to the release month of the games. The contextual visualizations helped in identifying the top 10 free and paid games in the platform and an increased playtime is observed for free games. Another visualization gave a generic insight that the average playtime spiked whenever a game is launched on console platforms. By analyzing the gaming platform data and visualizations, effective implementation can be made in terms of features, modified subscription services and improved gaming content.